6th grade data & graphing worksheets
10 data & graphing skills at 6th grade, one sheet each, free with its answer key: box plots, histograms, mean, median, mode & range, and more.
Nothing in 6th grade data & graphing matches that. Search every grade
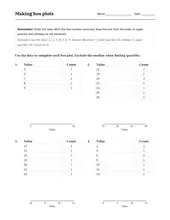
- Box plots The line inside the box is the median. Whisker ends mark the smallest and largest values, and box edges mark the quartiles.
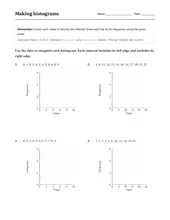
- Histograms Each bar counts a whole range of values. Read its height off the axis to see how many landed in that bin.
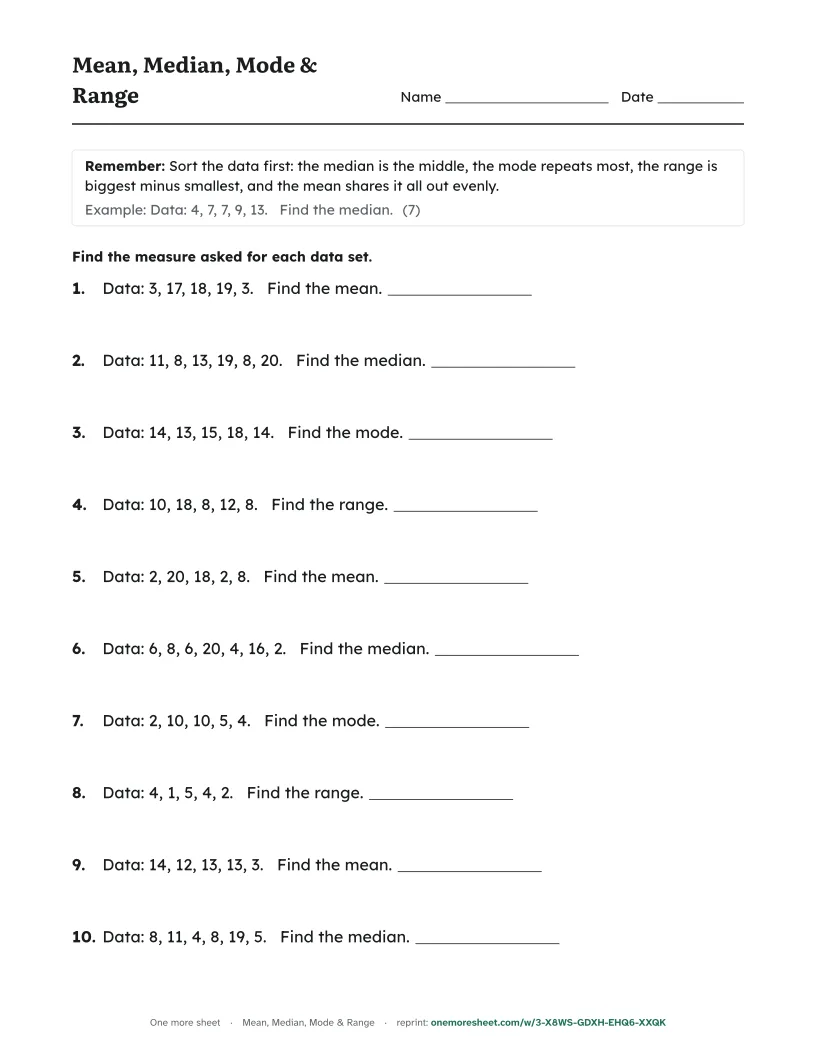
- Mean, median, mode & range Sort the data first: the median is the middle, the mode repeats most, the range is biggest minus smallest, the mean balances the values, and MAD is their average distance from the mean.
- Making box plots Use the data to complete each box plot. Exclude the median when finding quartiles.
- Making histograms Use the data to complete each histogram. Each interval includes its left edge and excludes its right edge.
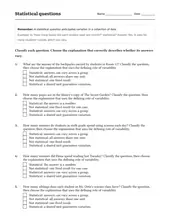
- Statistical questions Classify each question. Choose the explanation that correctly describes whether its answers vary.
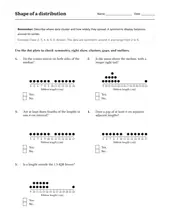
- Shape of a distribution Use the dot plots to check symmetry, right skew, clusters, gaps, and outliers.
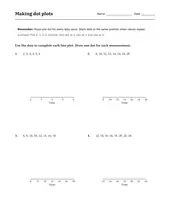
- Making dot plots Use the data to complete each line plot. Draw one dot for each measurement.
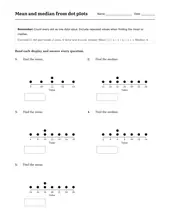
- Mean and median from dot plots Read each display and answer every question.
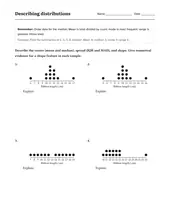
- Describing distributions Describe the center (mean and median), spread (IQR and MAD), and shape. Give numerical evidence for a shape feature in each sample.
All 6th grade math worksheets →
More 6th grade math: Word problems · Factors & patterns · Fractions · Decimals · Ratios & percents · Expressions & equations · Shapes & angles · Area & volume