Histograms worksheets
Each print is a different sheet with its own answer key. You don't need to sign up.
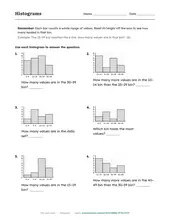
Each bar counts a whole range of values. Read its height off the axis to see how many landed in that bin.
Just 6th grade. Print it here, or open the page for examples and teaching notes.
Print by grade
-
6th grade Core grade
Each print is a different sheet with its own answer key. You don't need to sign up.
Sixth grade histogram worksheets include reading and construction. Reading questions ask for the frequency in a supplied interval. Construction questions provide measurement data, labeled intervals, and an axis on which students draw the bars. Each bar counts a range, not a single value.
More on statistics
All data & graphing worksheets →
Or all math worksheets: every grade, every topic.