Bar & line plots worksheets
Each print is a different sheet with its own answer key. You don't need to sign up.
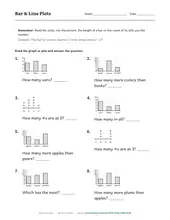
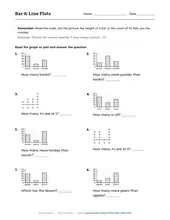
Read the scale, not the picture: the height of a bar or the count of Xs tells you the number.
Two grades, each its own sheet. Print one here, or open a grade for examples and teaching notes.
Print by grade
-
2nd grade
Bar graph and line plot worksheets for second grade print a small graph above every question. Your child reads one value, finds the biggest or smallest category, or compares two bars. Counts stay small enough to check by pointing.
-
3rd grade Core grade
Each print is a different sheet with its own answer key. You don't need to sign up.
Bar graph and line plot worksheets for third grade scale up: bars jump by fives, so reading the axis matters more than counting. Questions ask for one value, a comparison between categories, or the total across the graph.
More on graphs
All data & graphing worksheets →
Or all math worksheets: every grade, every topic.