Line plots with fractions worksheets
Each print is a different sheet with its own answer key. You don't need to sign up.
The ticks are the ruler and the Xs are the data. Every X is one measurement.
Two grades, each its own sheet. Print one here, or open a grade for examples and teaching notes.
Print by grade
-
4th grade Core grade
Each print is a different sheet with its own answer key. You don't need to sign up.
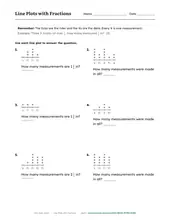
Line plot worksheets for fourth grade show measurement data: X marks stacked over a number line ticked in halves, quarters, and eighths of an inch. The questions stay with reading: how many measurements landed on 2 3/4, and how many in all.
-
5th grade
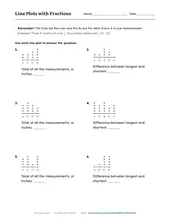
Fifth grade line plots keep the fraction ticks but put the data to work. Instead of counting Xs, questions ask for the total of all the measurements, or the difference between the longest and shortest. That means adding and subtracting fractions with unlike denominators.
More on graphs
All data & graphing worksheets →
Or all math worksheets: every grade, every topic.