Graphing proportional relationships worksheets
Each print is a different sheet with its own answer key. You don't need to sign up.
A proportional graph is a straight line through the origin. Read each coordinate using its axis label.
Just 7th grade. Print it here, or open the page for examples and teaching notes.
Print by grade
-
7th grade Core grade
Each print is a different sheet with its own answer key. You don't need to sign up.
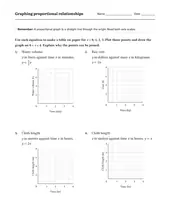
Use each equation to make a table on paper for x = 0, 1, 2, 3. Plot those points and draw the graph on 0 ≤ x ≤ 4. Explain why the points can be joined.
More on ratios, rates & percents
- Comparing rates with conversions 7th
- Equivalent ratios & ratio tables 6th
- Finding the constant across representations 7th
- Fractional unit rates 7th
- Fractions, decimals & percents 6th
- Interpreting proportional graph points 7th
- Multistep ratio applications 7th
- Percent of a number 5th–6th
- Proportionality in graphs 7th
- Proportionality in tables 7th
- Unit rates & ratios 6th
- Writing proportional equations 7th
All ratios & percents worksheets →
Or all math worksheets: every grade, every topic.